'Mapping Transportation Vulnerability in Hurricane Harvey'
Between August 17 and September 1, 2017, Hurricane Harvey, a Category 4 storm, brought unprecedented devastation to Houston and the Middle Texas Coast. As the first major hurricane to make landfall in Texas since Hurricane Celia in 1970, Harvey fundamentally reshaped how natural disasters are perceived and how communities prepare for extreme weather events (National Weather Service, 2017).
Between August 17 and September 1, 2017, Hurricane Harvey, a Category 4 storm, brought unprecedented devastation to Houston and the Middle Texas Coast. As the first major hurricane to make landfall in Texas since Hurricane Celia in 1970, Harvey fundamentally reshaped how natural disasters are perceived and how communities prepare for extreme weather events (National Weather Service, 2017).
Over the course of four days, the region experienced up to 60 inches of highly uneven rainfall, leading to catastrophic flooding, an estimated $125 billion in damages, and a death toll exceeding 35.
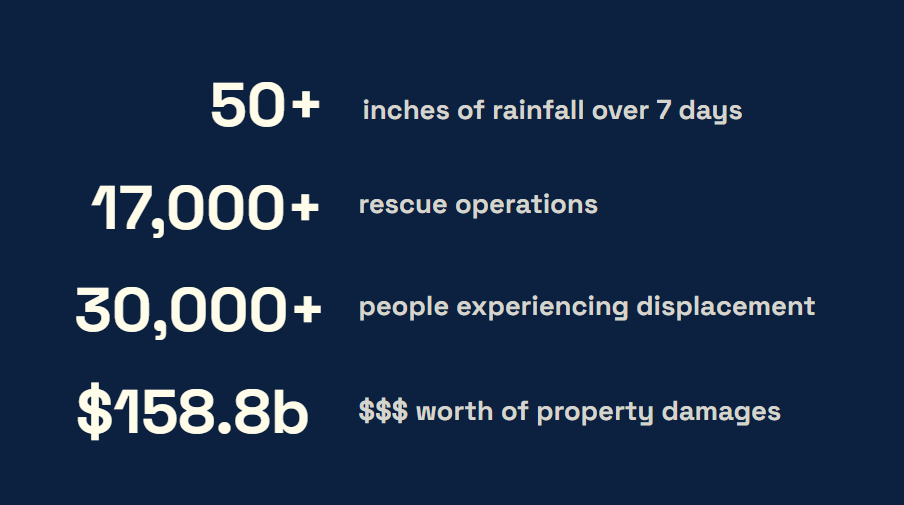
Impact of Hurricane Harvey, 2017. Source: U.S DHS
Which led us to our research question...
How can a GIS-based flood risk model guide equitable emergency planning and infrastructure resilience in Houston?
How can a GIS-based flood risk model guide equitable emergency planning and infrastructure resilience in Houston?
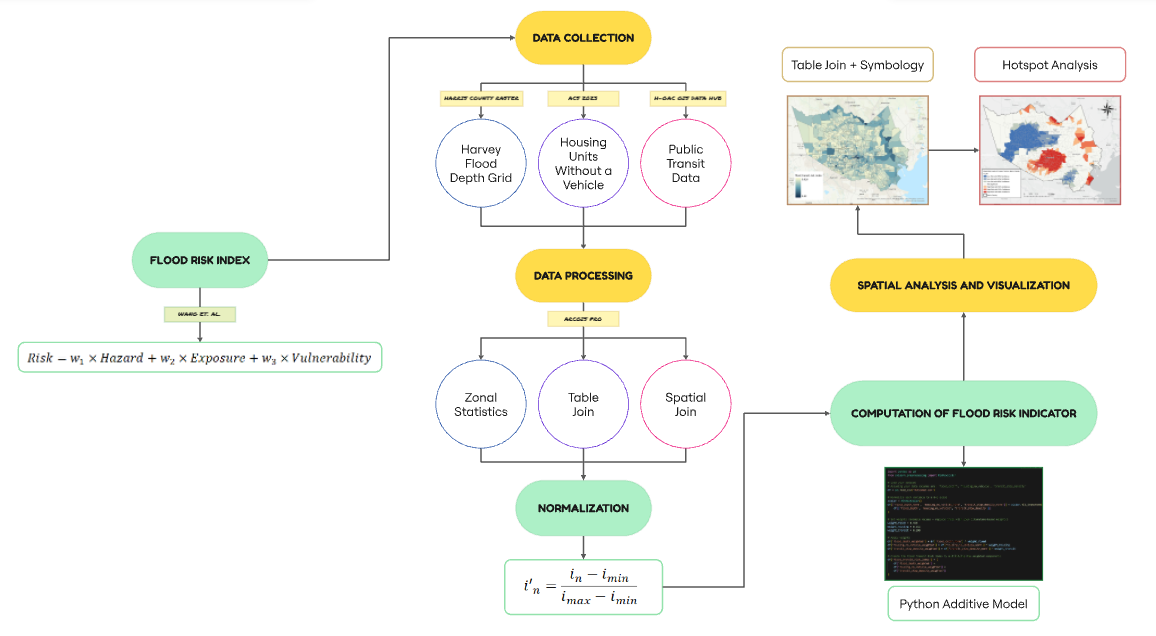
We developed a GIS-based risk assessment model to...
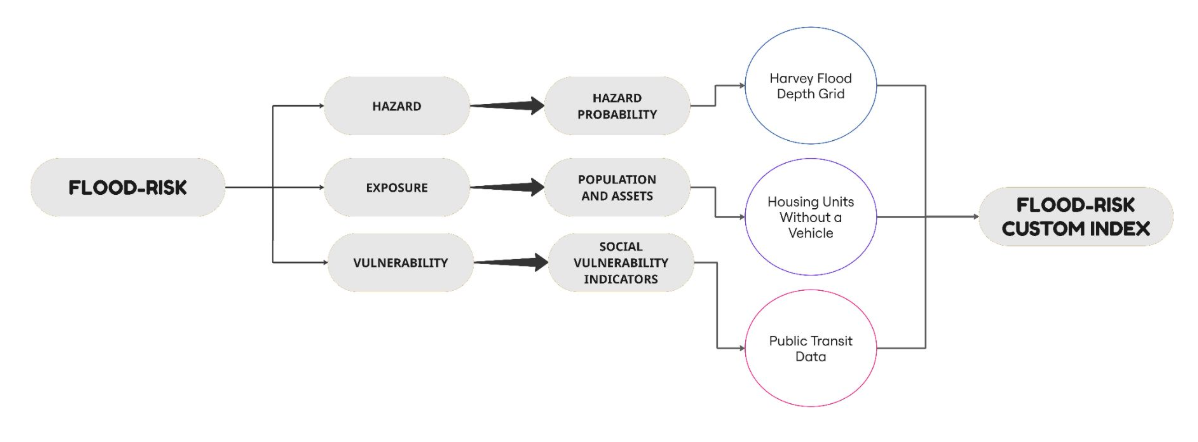
a. Identify high-risk flood zones using hazard probability, exposure, and social vulnerability metrics.
b. Create a custom localized risk index calibrated to Houston's transportation-disadvantaged populations, particularly public transit users.
c. Provide actionable policy recommendations to enhance emergency planning, transportation resilience, and equitable disaster preparedness.
a. Identify high-risk flood zones using hazard probability, exposure, and social vulnerability metrics.
b. Create a custom localized risk index calibrated to Houston's transportation-disadvantaged populations, particularly public transit users.
c. Provide actionable policy recommendations to enhance emergency planning, transportation resilience, and equitable disaster preparedness.
Findings
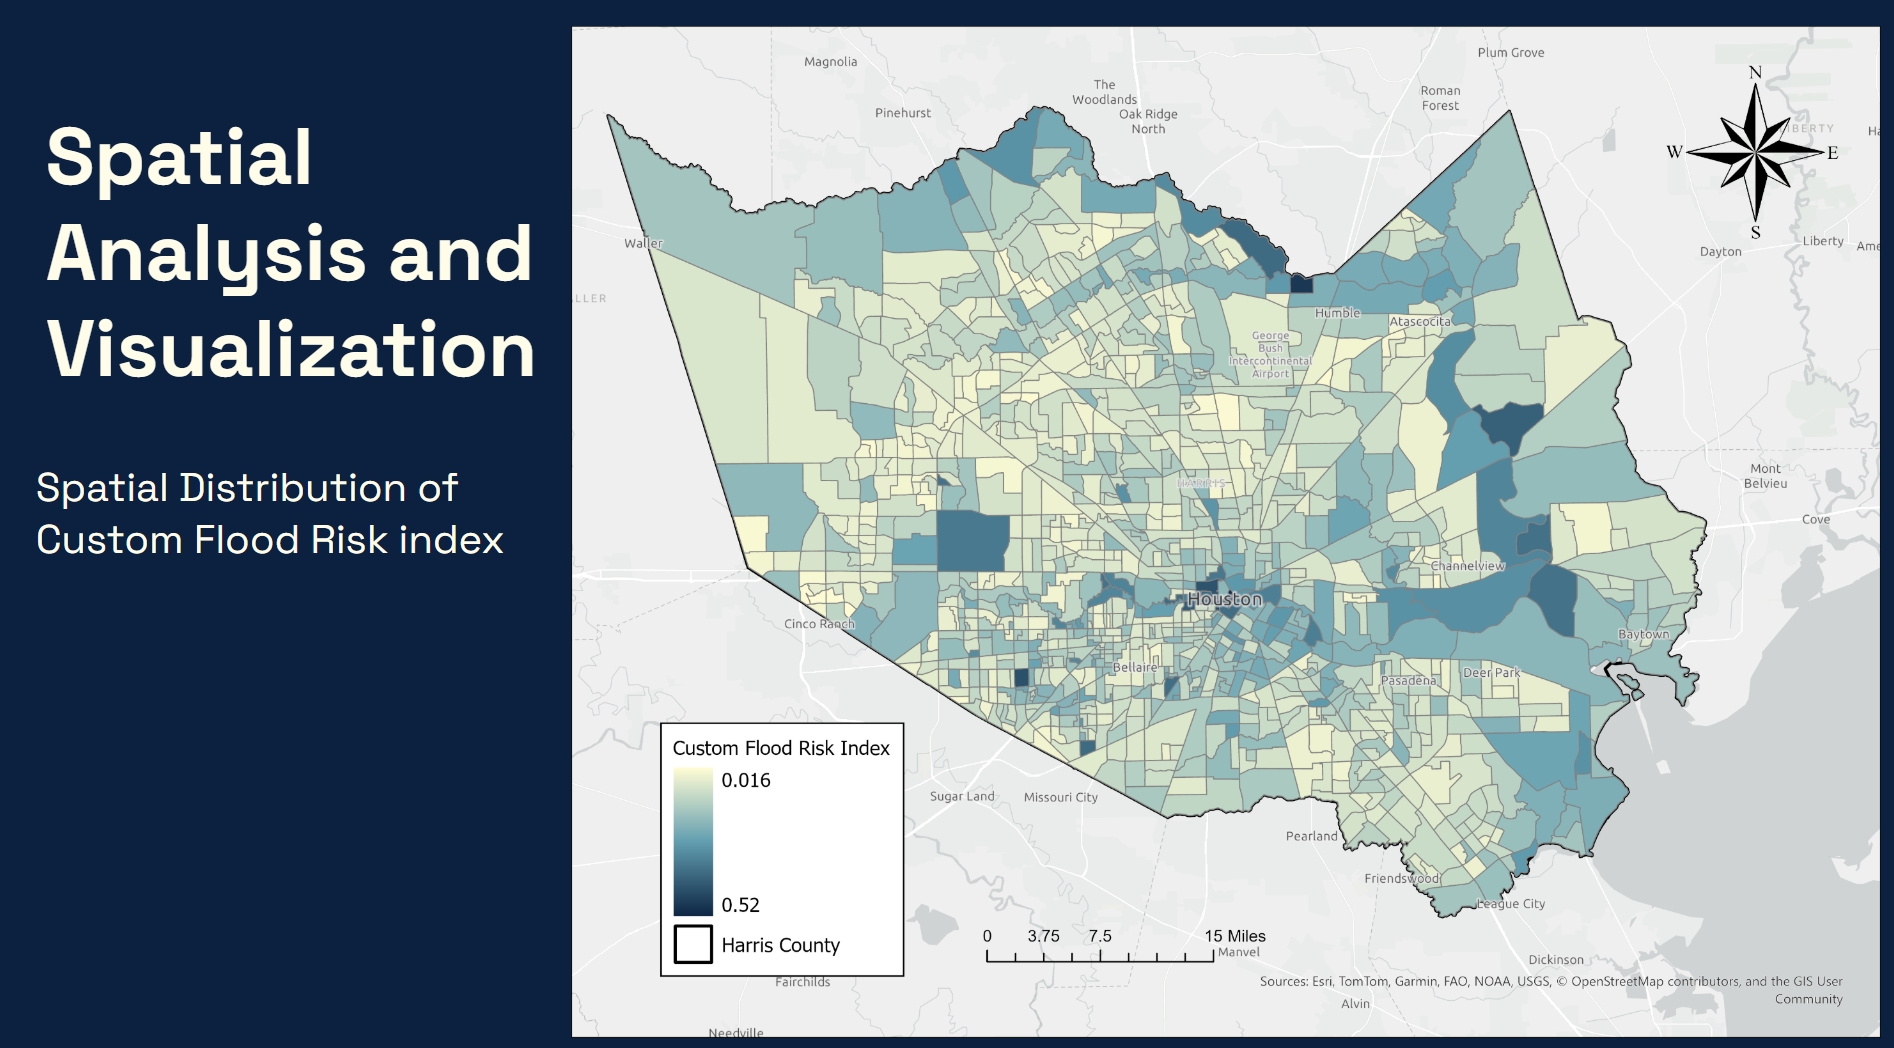
1. The spatial distribution map of custom flood risk index illustrated that flood risk is not uniformly distributed, but is concentrated in certain regions. In particular, high-risk areas are scattered throughout the central and eastern parts of Houston, as well as in southeastern area of Harris County near the coastline. In contrast, the western and northern suburban regions tend to exhibit relatively lower flood risk. The formula used to calculate the Custom Flood Risk Index assigns greater weights to hazard components, so areas with greater flood depths are assessed as being higher risk.
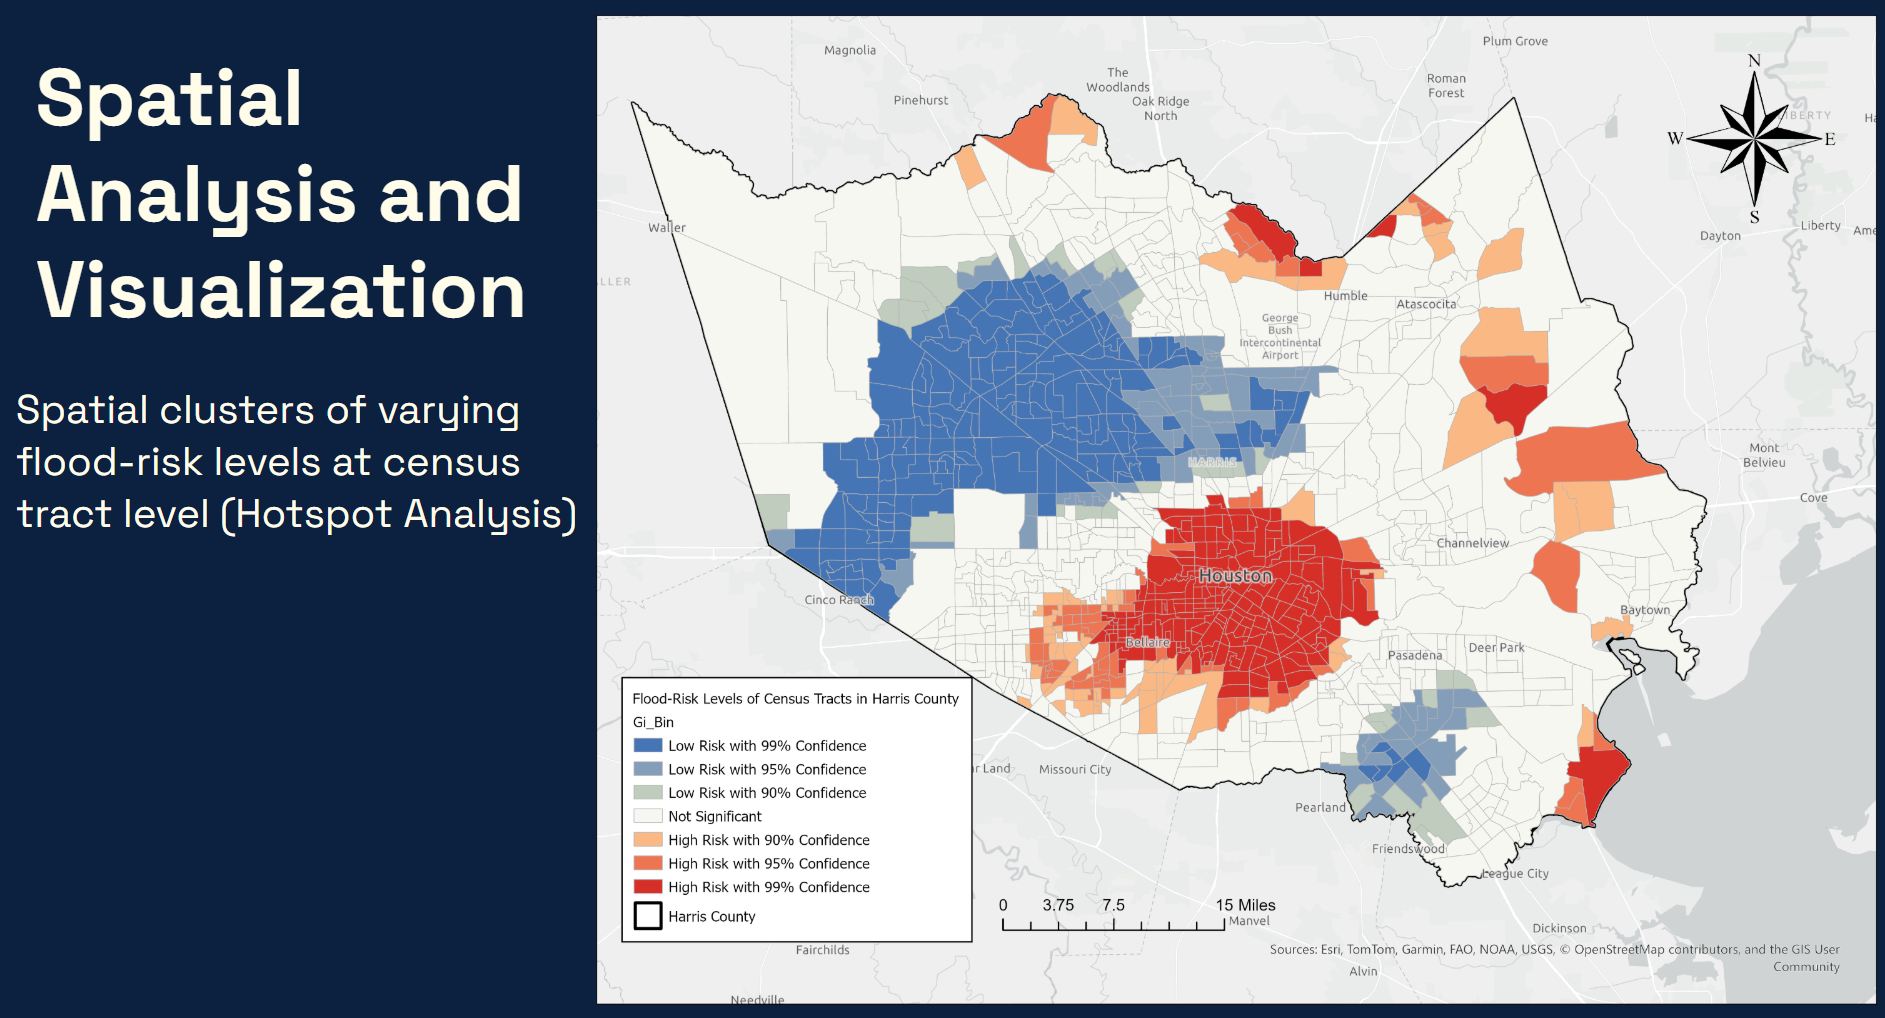
2. The hotspot analysis revealed that areas with high flood risk are concentrated in the central part of Houston while the northwestern and southeastern parts of the county show areas with statistically lower risks. This spatial distribution indicates a trend of flood risk shifting from the city center to the suburbs, suggesting the existence of spatial inequality in flood risk. Additionally, in the northeastern part, high-risk areas are scattered, and there is a concern that they may be isolated due to transportation network interruptions and evacuation difficulties in the event of a flood.
3. Our analysis also pointed toward the radial structure of Harris County's roadway system as being the root cause of bottlenecks during high-demand periods, which potentially amplifies the impact of flooding in peripheral areas due to evacuation delays and traffic congestion. Furthermore, for residents who rely on public transportation, the radial structure and infrastructural deficiencies make it difficult to secure safe evacuation routes, thereby exacerbating their vulnerability during disasters. This is especially critical for low-income individuals, the elderly, and those with limited mobility, for whom disruptions or delays in public transit can pose serious, even life-threatening risks.
2. The hotspot analysis revealed that areas with high flood risk are concentrated in the central part of Houston while the northwestern and southeastern parts of the county show areas with statistically lower risks. This spatial distribution indicates a trend of flood risk shifting from the city center to the suburbs, suggesting the existence of spatial inequality in flood risk. Additionally, in the northeastern part, high-risk areas are scattered, and there is a concern that they may be isolated due to transportation network interruptions and evacuation difficulties in the event of a flood.
3. Our analysis also pointed toward the radial structure of Harris County's roadway system as being the root cause of bottlenecks during high-demand periods, which potentially amplifies the impact of flooding in peripheral areas due to evacuation delays and traffic congestion. Furthermore, for residents who rely on public transportation, the radial structure and infrastructural deficiencies make it difficult to secure safe evacuation routes, thereby exacerbating their vulnerability during disasters. This is especially critical for low-income individuals, the elderly, and those with limited mobility, for whom disruptions or delays in public transit can pose serious, even life-threatening risks.
Collaborator: Takuto Enomoto